
THOUGHT LEADERSHIP | AIRBORNE INTELLIGENCE
What If the Air We Share Had a Weather App?
A new way to see, anticipate, and respond to the changing risks in the indoor environments we occupy every day
PJ Piper | CEO, Far UV Technologies | September 2026
We check the weather before deciding what to wear, when to exercise, where to travel and how to plan the day ahead. We consult hour-by-hour forecasts, storm alerts, pollen levels, temperature swings and outdoor air quality with almost no thought at all. What was once invisible uncertainty has become actionable information, available to nearly everyone, nearly everywhere, in seconds.
Indoor air — and the health risks associated with it — may be on the verge of a similar transformation. Most people still walk into a restaurant, gym, grocery store, airport, school, medical office or workplace knowing almost nothing about the air they are about to share. Yet the EPA estimates that Americans spend approximately 90% of their time indoors, where pollutant concentrations can sometimes be several times higher than outdoors. Indoor environments also play a major role in respiratory exposure, particularly when occupancy is high and ventilation or air cleaning is limited.
What has been missing is not merely awareness. It is a practical way to see changing conditions, compare locations and make better daily decisions. The Air We Share™ Airborne Intelligence Platform is designed to begin doing exactly that – combining near-real-time, crowdsourced and modeled signals into one place while showing users how engineering controls may change the environment they occupy.
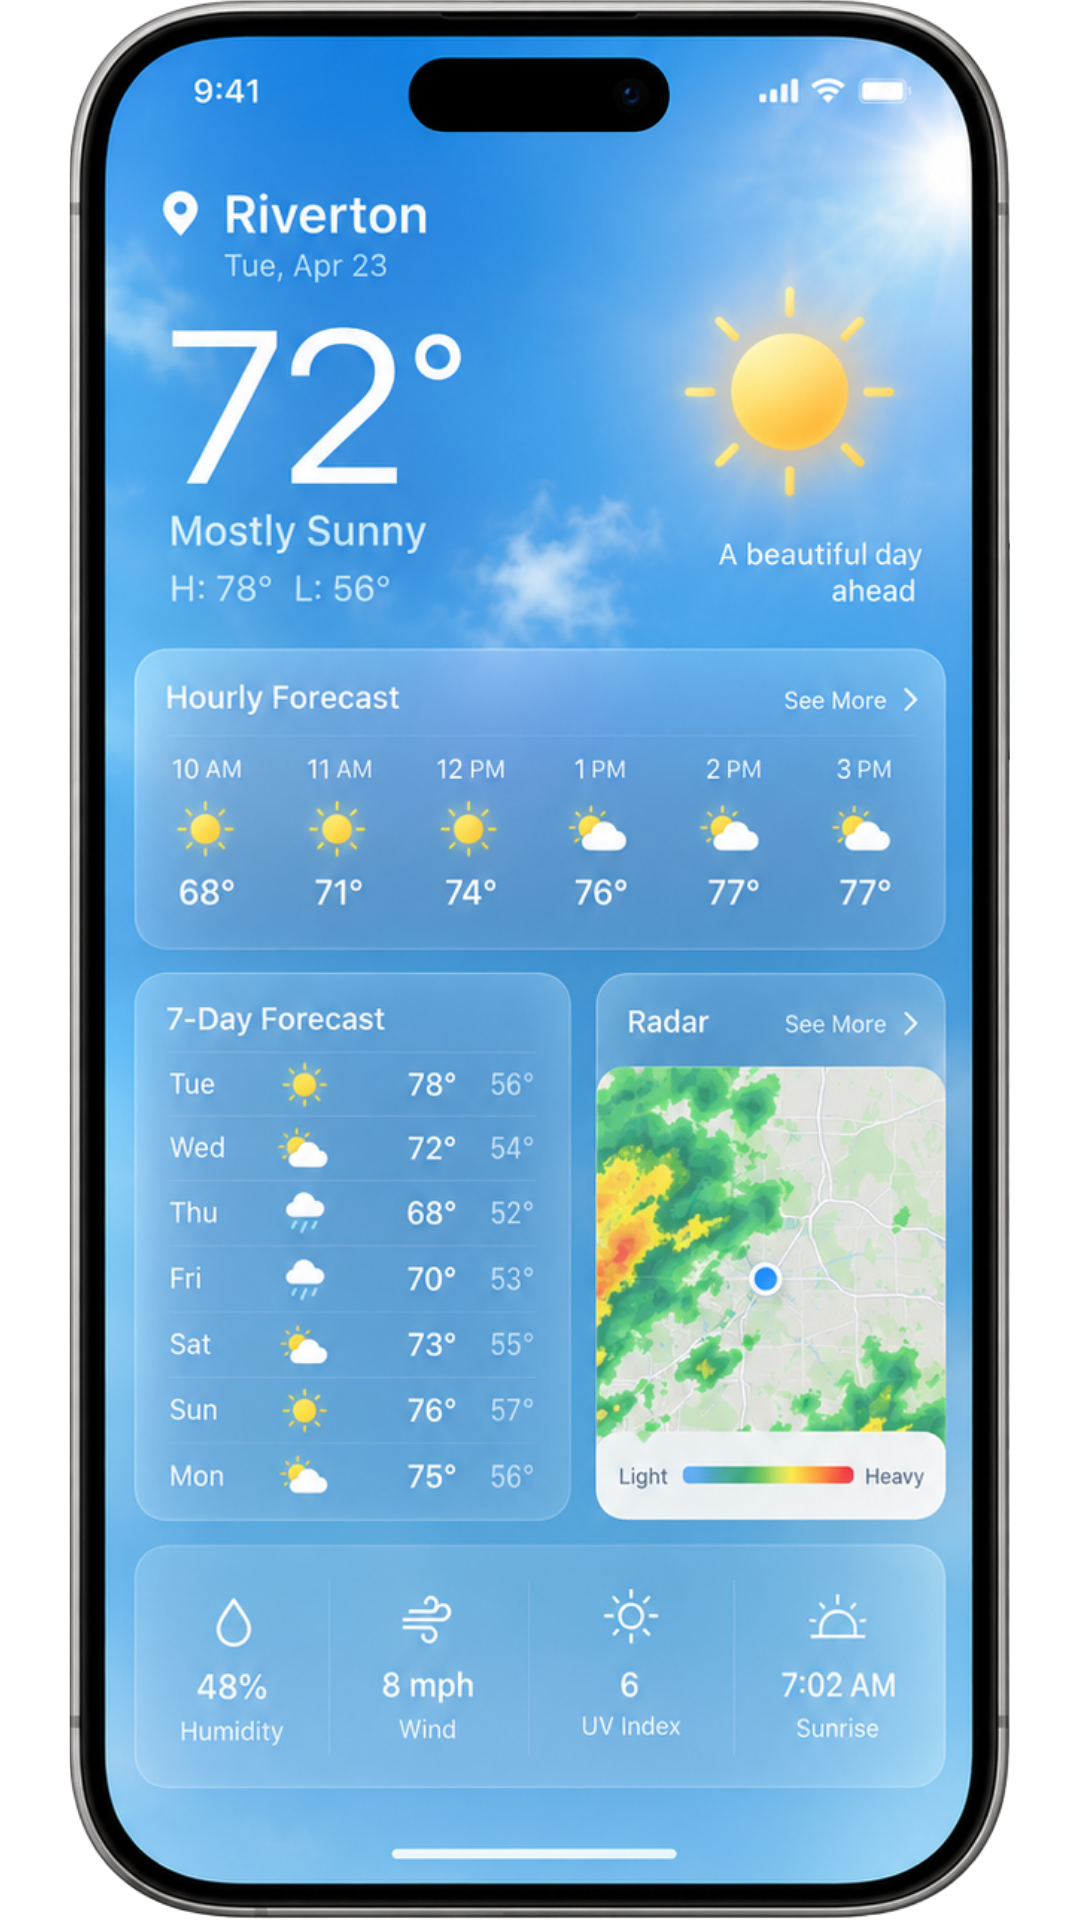
Figure 1. Representative weather-app interface — the familiar model for changing environmental information.
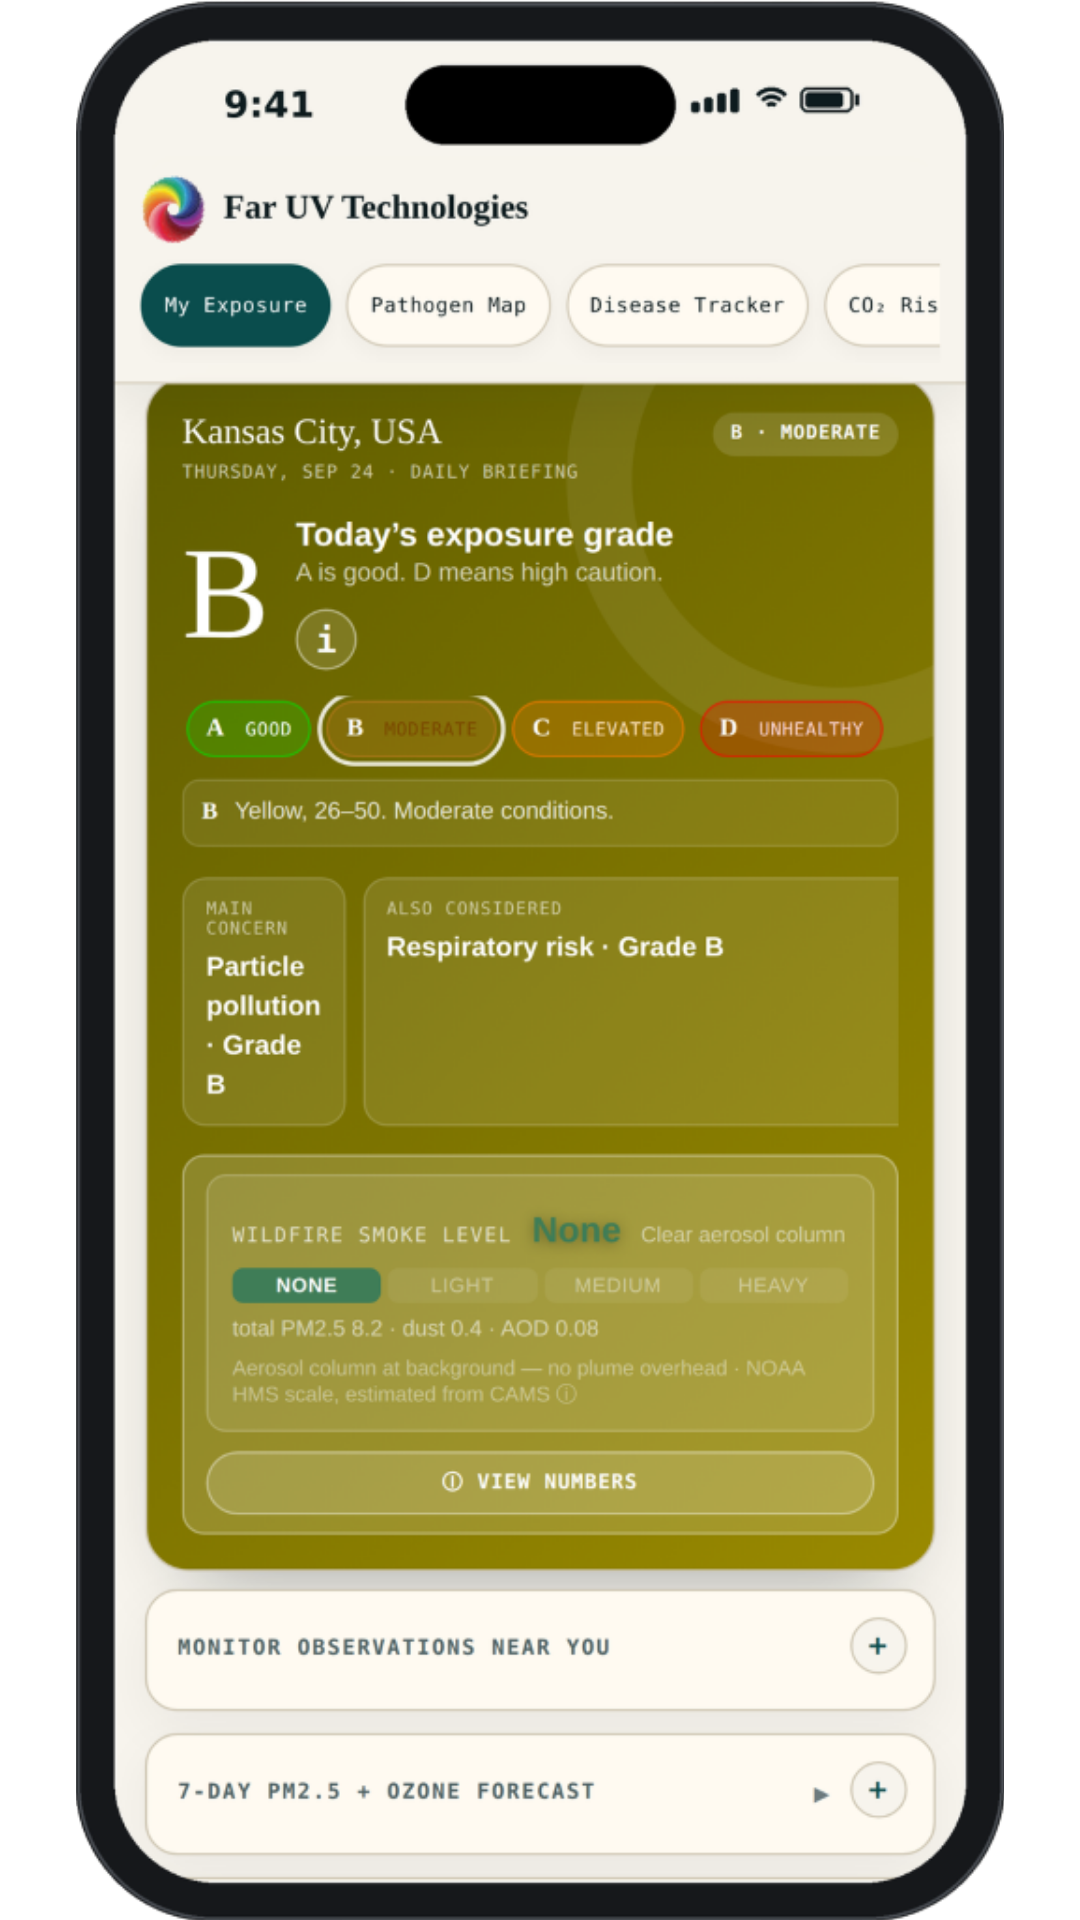
Figure 2. The Air We Share™ daily exposure briefing — the modeled grade for a selected location with its main contributing factors. Screenshot of the current platform.
From Weather Intelligence to Airborne Intelligence
The analogy is powerful because a weather app does not eliminate storms, pollen, heat or cold. It helps us anticipate, plan and adapt. It turns uncertainty into decision support. Airborne risk can work the same way.
Respiratory risk is not constant. It changes by place, time of day, occupancy, season, circulating disease conditions, outdoor air quality and the presence — or absence — of meaningful engineering controls. A crowded gym at 6:00 p.m. may present a different breathing environment than the same gym at 2:00 p.m. A restaurant before the dinner rush may differ materially from that same room two hours later.
The same is true across geography. One city may be experiencing increasing respiratory activity while another is quieter; wildfire smoke, ozone or pollen may alter the outdoor contribution to indoor air; and travel can place people into unfamiliar buildings where they have little sense of the ventilation or air-cleaning strategy.
Bringing the Signals Together
The platform begins by consolidating information that is otherwise fragmented. Its current prototype includes a daily modeled exposure briefing, seven-day PM2.5 and ozone forecast, hourly PM2.5 and allergy outlook, pathogen and air-quality heat map, disease tracker, CO₂ map, venue rankings and engineering-control modeling. The goal is not to imply that every signal is directly measured. The platform distinguishes connected or crowdsourced readings from estimates and modeled outputs, so confidence can improve as more direct data become available.
That distinction is important. Weather forecasts themselves combine measurements, models and probabilities. The useful question is rarely whether a model can guarantee what will happen. It is whether it gives us enough information to make a better decision than we could make without it. This is an early release, and we’re treating it as one. Some signals are still seeded from periodic public datasets rather than continuous live feeds, and calibration will improve as more direct, city-level data comes online. We’d rather be upfront about that trajectory than overstate where the platform is today — and feedback from early users, including on where an estimate looks off, is genuinely part of how the next version gets better.
Planning Around Daily Life — and Future Travel
Before visiting another city or country, we already check the weather, hotel options and transportation logistics. Increasingly, it may also make sense to ask: What respiratory illnesses are active there? What do recent trends suggest? What are the projected outdoor air-quality conditions? Which indoor environments appear better protected?
The app’s disease tracker is designed around that idea, allowing users to examine disease history and modeled scenarios across U.S. and international locations. Its prototype also lets users compare a conventional ASHRAE 62.1 ventilation baseline with ASHRAE Standard 241 and explore how selected controls may change modeled exposure.
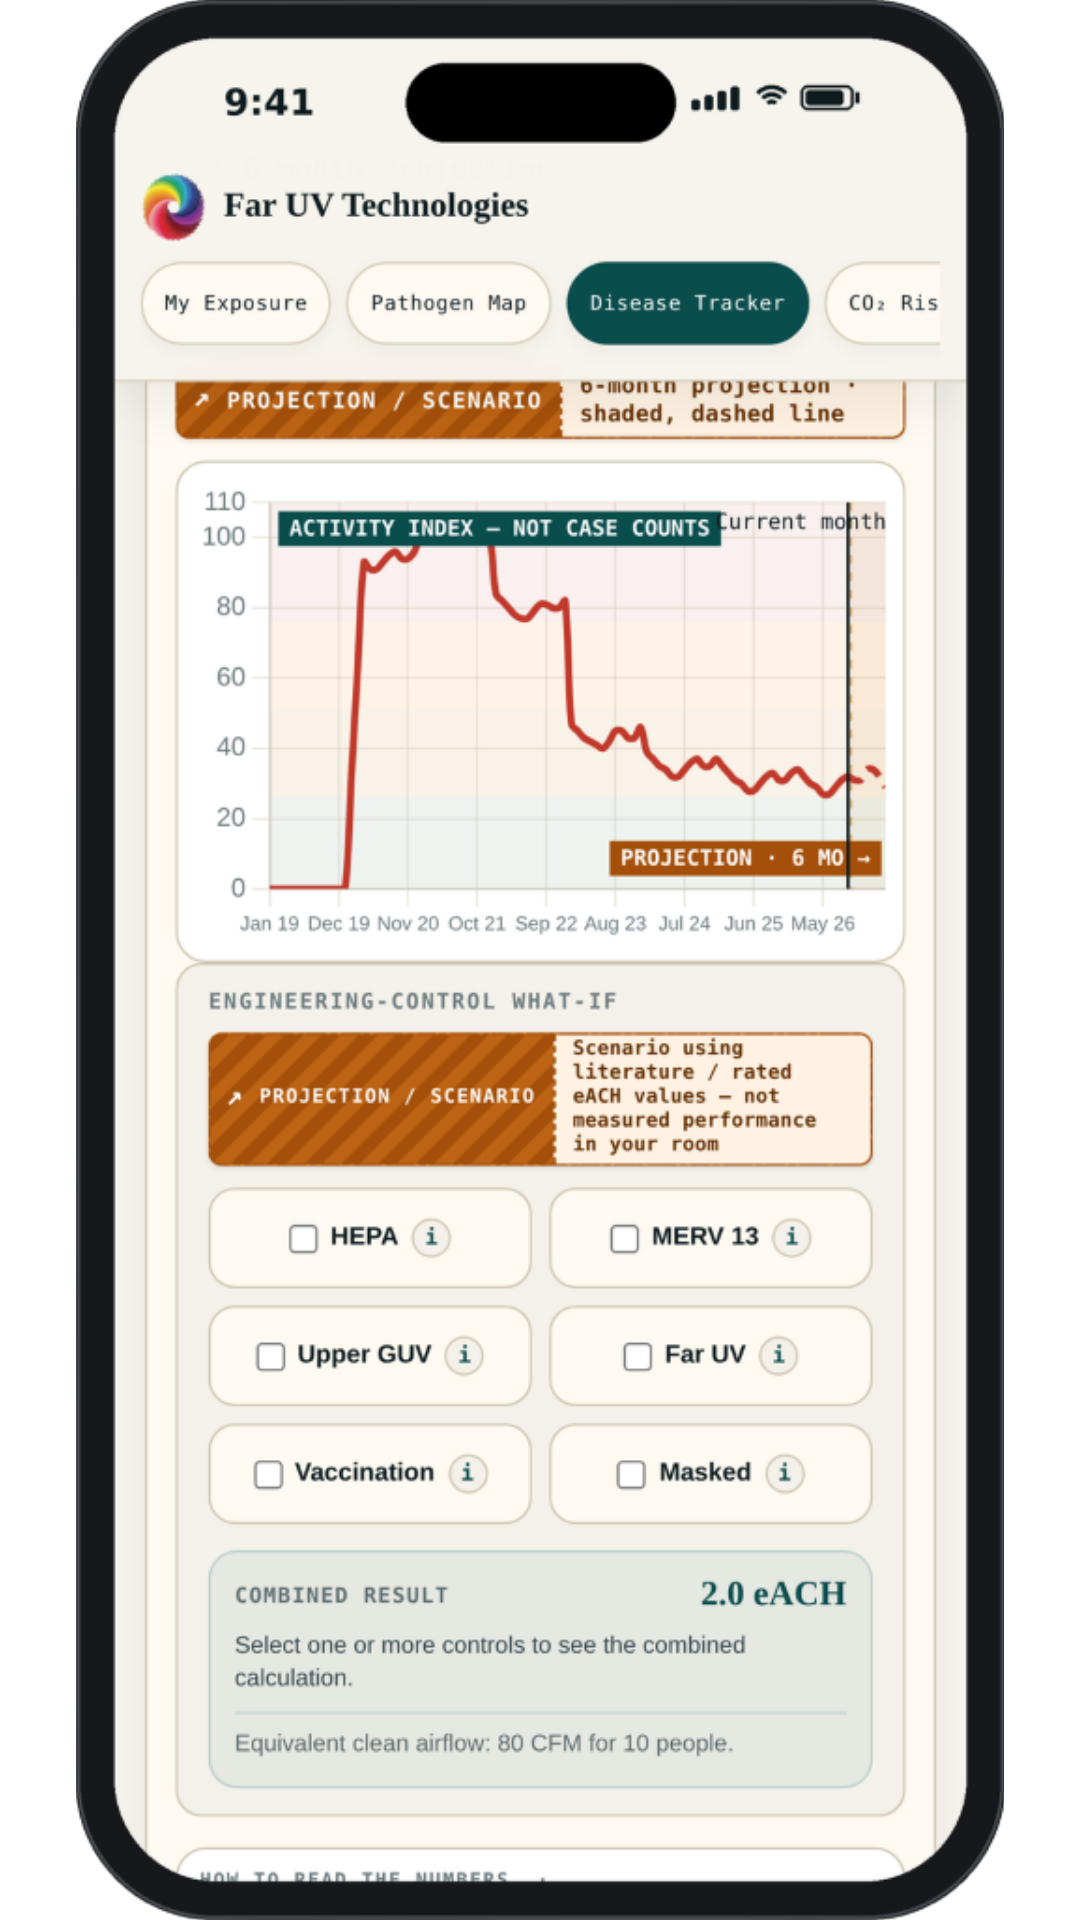
Figure 3. Disease history for a selected city and pathogen, with the ASHRAE 62.1 baseline and ASHRAE 241 IRMM comparison. Screenshot of the current platform; a modeled scenario, not a prediction of confirmed cases.
From Knowing the Risk to Changing It
The platform is most useful when it does more than describe the problem. It can help users evaluate responses. Better ventilation may be appropriate in one room. Portable HEPA filtration or improved HVAC filtration may be practical in another. Upper-room germicidal UV or Far UV at 222 nm can add an air-disinfection layer intended to reduce susceptible airborne microorganisms or allergens in occupied environments, when installed to recognized exposure limits (e.g., ACGIH Threshold Limit Values and ICNIRP exposure limits).
The CDC/NIOSH ventilation guidance recognizes ventilation and air cleaning as tools for reducing concentrations of airborne contaminants. ASHRAE Standard 241 goes further by using the concept of equivalent clean airflow, creating a common framework for comparing ventilation, filtration and air disinfection.
This is why the app’s engineering-control layer matters. It moves the user from “What is the risk?” toward “What could change it?” The current prototype can model combinations of portable HEPA, central HVAC filtration, upper-room GUV and Far UV, then show how those controls affect the modeled infectious-aerosol environment. We compare all of these because we work across all of them.
CO₂ also provides useful context because it can indicate how much exhaled air has accumulated in an occupied space. But CO₂ is not a pathogen detector, and filtration or germicidal air cleaning can reduce infectious aerosols without removing CO₂. The platform therefore treats raw CO₂ and modeled effective infectious-aerosol conditions as related but different concepts rather than pretending one number tells the whole story.
Imagine Choosing Places Partly by the Air
We already choose businesses based on variables that would once have been difficult to aggregate: ratings, price, distance, parking, wait times, cleanliness and crowding. It is reasonable to imagine air becoming another factor.
The prototype’s CO₂ map and nearby-place ranking tools allow users to search restaurants, gyms, stores, schools, hospitals, museums and offices. Where actual indoor CO₂ readings exist, they can contribute to a venue’s picture. Where they do not, the app marks results as estimates rather than presenting modeled values as measurements. That transparency is essential to credibility.
A single portable CO₂ monitor tells one person something about one room. Thousands of people contributing readings begin to create a shared map of indoor conditions. Over time, businesses themselves could contribute verified measurements and information about ventilation, filtration or germicidal air-cleaning systems. Consumers could reward healthier buildings with their business, creating a new incentive for cleaner indoor air.
Crowdsourced systems only work if the incentives stay healthy. A miscalibrated consumer sensor, a one-off bad reading, or a venue gaming its own listing can distort the picture as easily as improve it — which is why the platform weights trends built from many readings over time more heavily than any single submission, and always labels crowdsourced values as such rather than blending them with verified or regulatory data. Getting that balance right is as much an ongoing project as the models themselves.
The Next Environmental Signal in Our Pocket
A century ago, the idea that nearly every person would someday carry an hour-by-hour weather forecast for almost any location on Earth would have sounded extraordinary. Today we barely think about it. Indoor-air intelligence is much earlier in that journey, but the pieces are beginning to connect.
We may eventually reach a point where checking airborne conditions before travel, an important event or a crowded indoor activity feels as natural as checking the weather. Not because every risk can be predicted, and not because every exposure can be avoided, but because invisible risks become easier to manage when they are made visible.
We all share the air. Increasingly, we may also want to track it, understand it and improve it.
Explore The Air We Share™ Airborne Intelligence Platform
trackingpathogenapp.netlify.app/

Scan to open the platform in your browser. No app store download required.