
THOUGHT LEADERSHIP | EQUITABLE ACCESS
Equitable Access to the Air We Share
Immunocompromise, disability law, and the economic case for evaluating cleaner indoor air as accessible infrastructure
PJ Piper | CEO, Far UV Technologies | October 2026
Disclosure: The author is CEO of a company that manufactures germicidal ultraviolet and HEPA filtration air-treatment technologies. The legal, economic, and engineering arguments below are offered for evaluation on their merits.
The Policy Question
The Americans with Disabilities Act changed the built environment after the nation recognized that a doorway, stair, or restroom designed for only some bodies could exclude people from work, education, commerce, and civic life. For people whose immune systems make respiratory infection unusually consequential, the barrier may be less visible but no less practical: they can enter a building and still be unable to participate safely in the activity inside it. The policy question is therefore narrow but consequential: when should cleaner indoor air be evaluated as a reasonable accommodation or modification, and when should it be treated as ordinary accessible infrastructure?
Existing federal law does not supply a universal clean-air mandate, and this paper does not assume one. It asks whether the ADA’s governing idea—remove avoidable environmental barriers so qualified people can participate— offers a useful framework for individualized accommodations, targeted public investment, and future building standards.
The ADA’s historical lesson is not that every barrier warrants the same remedy. It is that design choices can determine who gets to participate—and that the economic value of access can far exceed the cost of providing it.
In brief
Who is affected. About 7.7 million U.S. adults are moderately to severely immunocompromised; up to about 17 million report some immunosuppression.
What the law requires today. No universal clean-air standard, but individualized review of accommodations that can include engineered air.
What the evidence shows. Severe subgroups lose months of work. Each $1 billion of annualized program cost breaks even if about 0.2% of work among the clinically immunocompromised population is preserved.
What this paper asks for. Device-neutral federal guidance, a funded costing study and pilots, and performance-based targets in future building standards—with individualized ADA review preserved (see “What We Are Asking For”).
Who Is Affected
The constituency is both larger and more varied than the public discussion often suggests. CDC has historically estimated that people who are moderately to severely immunocompromised comprise about 3% of U.S. adults. A nationally representative 2021 survey published in JAMA estimated broader self-reported immunosuppression at 6.6%—roughly one in fifteen adults, or about 17 million people when applied to the adult population. The estimates should be presented as a range, not merged (Table 1).
Table 1. Two estimates of the immunocompromised population, used for different purposes
| Estimate | Share of U.S. adults | People | What it counts | Used in this paper for |
|---|---|---|---|---|
| CDC clinical estimate | about 3% | roughly 7.7 million | Moderately to severely immunocompromised—a narrower clinical category | All dollar estimates, because the leave evidence describes people whose immune status is moderate to severe |
| JAMA self-reported estimate (2021 survey) | 6.6% (about one in fifteen) | about 17 million | A condition, prescription, treatment, or recent hematologic cancer reported to weaken the immune system | Describing who has a stake, including many people whose immunosuppression is real but comparatively mild |
Sizing a severity-anchored cost estimate off the broader population would overstate its plausibility.
Common pathways include active treatment for solid tumors or blood cancers; organ or stem-cell transplantation and anti-rejection therapy; moderate or severe primary immunodeficiency present from birth; advanced or untreated HIV; and high-dose corticosteroids, biologics, chemotherapy, and other immunosuppressive medicines. CDC’s clinical examples illustrate why this is not a single disease constituency.
Exclusion does not stop with the individual. Census QuickFacts reports 2.53 persons per U.S. household; applied mechanically to the broader 17 million-person constituency, that yields roughly 43 million person-household connections—a ceiling for illustration, not a precise count, and evidence that accessible air is a household- and community-level question
What the Law Requires Today
The ADA does not currently require every covered building to meet a single infectious-aerosol standard. It does require covered employers, public entities, and public accommodations to consider reasonable accommodations or modifications for qualifying disabilities, subject to setting-specific limits such as undue hardship, direct threat, or fundamental alteration. The analysis is individualized: a diagnosis alone does not dictate the result, and an organization may provide an effective reasonable option even if it is not the requester’s preferred option. The statute and implementing framework therefore support evaluation, not a predetermined engineering prescription.
Depending on the setting and documented need, options can include remote or hybrid participation, schedule or room changes, masking in defined circumstances, increased outdoor air, improved HVAC filtration, portable HEPA filtration, or appropriately designed germicidal ultraviolet air treatment. Each option carries its own cost, maintenance, and safety profile—germicidal UV, for instance, requires attention to wavelength selection and exposure limits—that a case-specific reasonableness analysis should weigh rather than assume away. The legal question is whether the measure is effective and reasonable in context—not whether all infection risk can be eliminated.
Early case law
Courts have begun to apply this framework to respiratory vulnerability. In the Third Circuit’s nonprecedential August 2026 ruling in Gardner v. Kutztown University, a package that included specialized air filters was held reasonable as a matter of law. That outcome favored the institution’s substitute measure over the professor’s preferred remote teaching, which is precisely why it matters here: it is not binding precedent, but it is a concrete example of a federal appellate court treating engineered air-risk mitigation, on its own, as a legally sufficient accommodation. Brown and L.E. confirm that disability status and reasonableness are decided case by case. Engineering controls also avoid the compliance friction of masks, because the protection operates in the background—a reasonable inference, though not yet proven by comparative political research.
Why the ADA Is the Right Frame
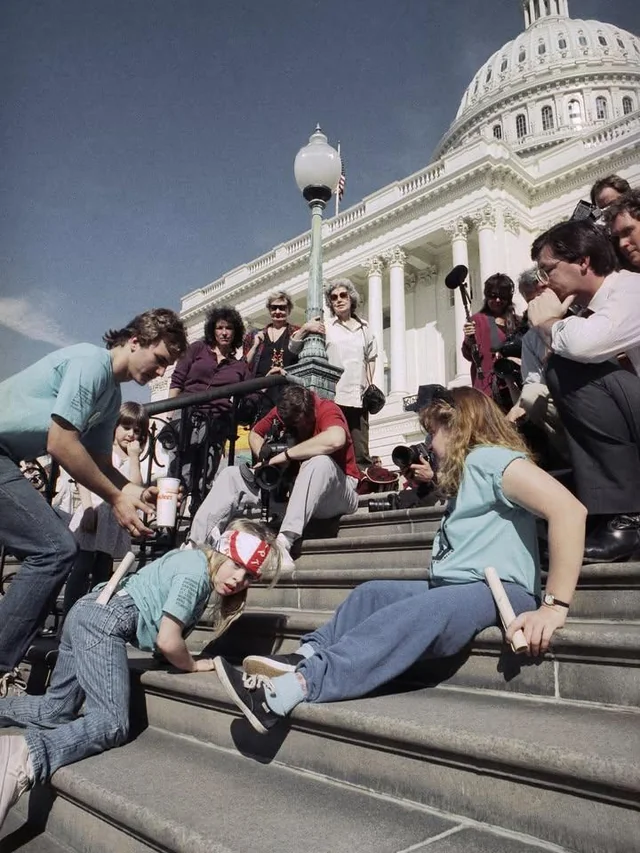
The ADA’s governing idea is to change the environment rather than the person. It grew out of Section 504 of the Rehabilitation Act of 1973 and passed with unusually broad bipartisan support before President George H.W. Bush signed it on July 26, 1990. Its most visible architectural expression, wheelchair access, serves a small share of the population—about 1.4% of Americans age 15 or older used a wheelchair or similar mobility device—and the country built it into new construction anyway. The underlying judgment was not that ramps eliminated disability; it was that design should not impose a needless barrier.
A useful economic precedent exists, although not a ramp-only ROI. DOJ’s 2010 benefit-cost analysis of the revised ADA design standards found benefits exceeding costs at both discount rates it tested (1.7-to-1 at 7%; 2.6-to-1 at 3%). The mechanism differs from the earnings-based estimates used later in this paper—those benefits were mostly user time savings—so the parallel should be read at the level of category, not magnitude: rigorous accessibility analysis can find net-positive economic value, not that a ramp’s return rate predicts an air-quality return rate.
Cleaner Air as Measurable Infrastructure—and an ROI Test
A single national participation-loss rate for immunocompromised Americans does not exist, and applying a small arbitrary percentage to the full 17 million would obscure the real pattern: burden varies sharply, while severe subgroups can lose months or leave circulation entirely. More specific evidence provides a better anchor (Table 2).
Table 2. Evidence anchors: employment and leave among cancer, transplant, and graft-versus-host disease populations
| Population | Measure | Finding | Source |
|---|---|---|---|
| Cancer survivors who worked at or since diagnosis (U.S. national study) | Reported cancer-related employment changes | 41.3% | CDC study |
| Of those reporting changes | Took extended paid time off | 75.4% | CDC study |
| Of those reporting changes | Made other changes, such as part- time or less demanding work (categories overlap) | 46.1% | CDC study |
| Employed people receiving cancer treatment | Additional workdays missed per year vs. workers not in treatment | about 22 days | NCI summary |
| Employed stem-cell transplant recipients with graft-versus-host disease (2025 claims study) | Mean short-term disability leave | 103 days | Claims study |
| Same population | Mean long-term disability leave | 120 days | Claims study |
| Same population, patients with both claim types | Mean combined leave | 127 of 261 workdays—nearly half a work year | Claims study |
These subgroup findings cannot be generalized to every immunocompromised person, but they support duration-based scenarios measured in months rather than fractions of a percentage point.
Using the 2024 BLS median full-time wage of $1,192 per week ($61,984 annually), the direct-earnings scale is substantial. Table 3 applies three illustrative combinations of share unavailable and duration to the narrower, 7.7 million-person clinically-severe cohort.5
Table 3. Illustrative annualized direct-earnings loss (7.7 million-person cohort; $61,984 per FTE-year)
| Scenario | Share of cohort unavailable | People | Time unavailable | Annualized loss |
|---|---|---|---|---|
| A | 5% | 385,000 | 3 months | about $6.0 billion |
| B | 10% | 770,000 | 6 months | about $23.9 billion |
| C | 20% | 1,540,000 | 6 months | about $47.7 billion |
These are transparent scenarios, not prevalence estimates or causal forecasts. They exclude nonworkers, part-time variation, employer output, tax receipts, replacement costs, health spending, unpaid care, and missed education. They also assume, generously, that cleaner air could recover the full loss; in practice it addresses only the infection-risk share of absence—not the fatigue, treatment toxicity, or recovery time that drive much of the leave data cited above—so realized recovery would likely be a fraction of these totals.
The Economic Cost of Exclusion
The engineering premise is administrable. ASHRAE Standard 241 establishes an equivalent-clean-air framework for reducing exposure to infectious aerosols in new and existing buildings. CDC/NIOSH ventilation guidance identifies outdoor air, filtration, portable air cleaners, and germicidal ultraviolet systems as tools that can reduce airborne pathogen concentrations when properly selected, designed, and commissioned. A policy can therefore specify performance, verification, and maintenance rather than mandate one device.
No credible national estimate yet establishes the annual cost or causal labor-market benefit of a defined clean-air accessibility program, so a claimed national ROI would be premature. A break-even test is more honest. At $61,984 per full-time-equivalent year, every $1 billion in annualized program cost would break even on direct earnings alone if it preserved about 16,100 FTE-years—about 0.209% of the narrower, 7.7 million-person clinically-severe cohort used in this section. The cost side of this test is illustrative spacing, not a vetted budget estimate: no published source yet prices a defined national clean-air accessibility program by building type, square footage, or equipment class, and that costing is a necessary next step this paper does not attempt. The thresholds scale linearly (Table 4).
Table 4. Break-even thresholds and an illustrative return scenario
| Break-even thresholds | Illustrative scenario: 154,000 FTE-years preserved ≈ $9.5 billion | |||
|---|---|---|---|---|
| Annualized policy cost | FTE-years needed to break even | Share of 7.7M cohort | Gross benefit-cost ratio | Net ROI |
| $1 billion | 16,100 | 0.209% | 9.5:1 | 850% |
| $5 billion | 80,700 | 1.048% | 1.9:1 | 90% |
| $10 billion | 161,300 | 2.095% | 0.95:1 | -5% |
How to read Table 4. The scenario assumes cleaner-air measures preserve 154,000 FTE-years—2% of the narrower, 7.7 million-person cohort, bounded to the infection-risk-attributable share of the leave data cited above—worth about $9.5 billion in direct earnings. Ratios and net ROI are derived directly from that rounded figure (benefit ÷ cost; net ROI is the ratio minus 1), so every number in the table is reproducible by hand. The $10 billion row lands just below break-even: it requires 2.095% of the cohort, and the scenario assumes 2%. This remains a sensitivity analysis, not a forecast; it excludes health- care savings and spillover benefits, and it assumes the preserved work is attributable specifically to reduced infection exposure rather than to the other clinical factors that also drive leave.
What We Are Asking For
The most defensible next step is to evaluate cleaner air with the same disciplines applied to other accessibility investments: define the covered setting and population; measure baseline air performance; select an equivalent- clean-air target; compare capital, operating, and maintenance costs with attendance, leave, health-utilization, and participation outcomes; and preserve individualized ADA review. Priority settings could be tested first where exclusion carries the highest consequences—health care, schools, workplaces, transportation, and essential public services.
This paper does not ask for a universal clean-air mandate. It asks for four specific actions:
| # | Who | The ask | Why it matters |
|---|---|---|---|
| 1 | Federal civil-rights agencies (e.g., DOJ, EEOC, HHS) | Issue device-neutral guidance confirming that engineered air measures (ventilation, filtration, portable air cleaning, germicidal UV) belong among the options in individualized accommodation analysis, and that an equivalent-clean-air target can define “effective” without prescribing a device. | A clear reference for employers, schools, and public entities that preserves case-by-case review. |
| 2 | Congress and federal research funders | Fund a costing study that prices a defined clean-air accessibility program by building type, square footage, and equipment class, plus outcome measurement. | Supplies the cost side that Table 4 leaves open. |
| 3 | Public entities, health systems, schools, and large employers | Run time-limited pilots in priority settings, following the evaluation steps above; meanwhile, include engineered air measures in the standard menu considered for accommodation requests. | Replaces scenarios with measured returns. |
| 4 | Standards bodies and state and local code officials | Evaluate performance-based equivalent-clean-air targets (such as ASHRAE Standard 241) for priority settings in future building standards, renovations, and capital planning. | Moves toward infrastructure without mandating one device. |
If the return in some settings is genuinely this favorable, the more interesting question is why it has not already been captured voluntarily; split incentives between building owners and occupants, and the same coordination and information failures that justified the ADA’s original mandates, are the likely answers—and both point toward a policy role rather than away from one.
In Closing
Cleaner indoor air should be evaluated—not assumed—as an accessibility question. Millions of people are affected; current law already requires individualized consideration of accommodations that can include engineered air; severe subgroups lose months of work; and the return depends on costs no one has yet measured. That is why this paper asks for guidance, costing, pilots, and performance-based standards rather than a mandate. For millions of people whose immune defenses are compromised by treatment, transplantation, medication, congenital disease, HIV, or other conditions, access to the air we share is now a concrete legal, engineering, and economic question.
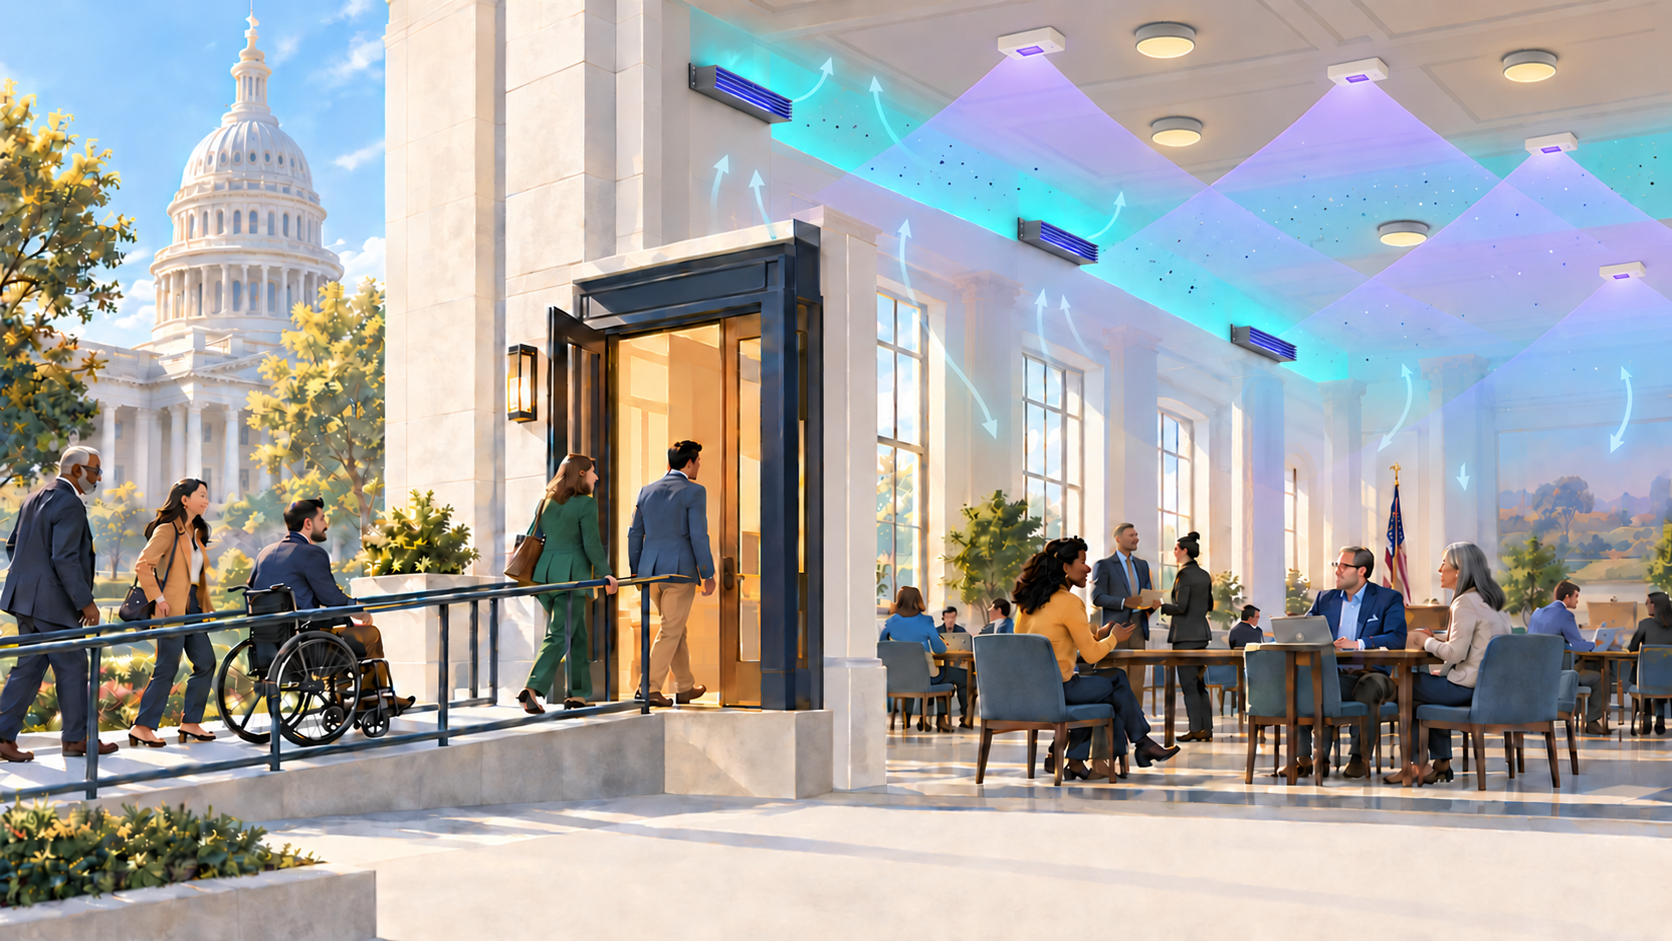
Access to the building. Access to the air inside. Engineered air treatment—filtration, ventilation, or germicidal UV among them—can extend an accessible-design mindset from the entrance to the room itself. Illustrated conceptually.
Appendices
Background and supporting detail referenced in the footnotes. Nothing here is required to follow the argument.
Appendix A. ADA background and economic precedent
The legal origin story begins with Section 504 of the Rehabilitation Act of 1973, the first federal civil-rights protection against disability discrimination in federally funded programs. The ADA extended that principle across employment, state and local government, public accommodations, transportation, and communications. Its support was unusually broad: the Senate initially passed the bill 76–8; the final conference measure passed the House 377–28 and the Senate 91–6 before President George H.W. Bush signed it on July 26, 1990. Congressional action and vote history confirms that bipartisan record.
Wheelchair access became the ADA’s most visible architectural expression, even though the statute protects a much wider range of disabilities. DOJ’s demographic analysis estimated that about 1.4% of Americans age 15 or older used a wheelchair or similar mobility device. The country nonetheless made accessible routes, entrances, door clearances, parking, and restrooms routine features of new construction and alterations under the ADA Standards for Accessible Design. The underlying judgment was not that ramps eliminated disability; it was that design should not impose a needless barrier.
In 2010, DOJ commissioned a benefit-cost analysis of the revised ADA design standards (Table A1). DOJ attributed 93% of quantified benefits to time savings for users and noted additional benefits it could not monetize. These figures evaluate the 2010 revisions, not the entire 1990 ADA and not wheelchair ramps alone; they nonetheless show that accessibility rules can create measurable economic value as well as civil-rights value. The mechanism is not identical to the earnings-based estimates used in this paper—these benefits were driven by physical-navigation time savings, not preserved wages—so the parallel should be read at the level of category, not magnitude: rigorous accessibility analysis can find net-positive economic value, not that a ramp’s return rate predicts an air-quality return rate.
Table A1. DOJ benefit-cost analysis of the 2010 revised ADA design standards
| Discount rate | Benefits | Costs | Benefit-cost ratio | Net present value |
|---|---|---|---|---|
| 7% | $22.0 billion | $12.8 billion | 1.7-to-1 | $9.3 billion |
| 3% | $66.2 billion | $25.8 billion | 2.6-to-1 | $40.4 billion |
Net present value at 3% is benefits minus costs ($66.2 billion − $25.8 billion). Source: DOJ regulatory impact analysis of the 2010 standards (linked above).
Appendix B. Who is affected: additional detail
Long COVID is best treated as a recent catalyst and an overlapping disability population: HHS and DOJ guidance states that it can qualify as a disability when it substantially limits a major life activity, but qualification remains individualized and Long COVID should not be described as universally immunocompromising.
Table B1. Household reach: a ceiling, not an estimate
| Item | Value |
|---|---|
| Broader constituency (JAMA estimate) | about 17 million people |
| Persons per U.S. household (Census QuickFacts) | 2.53 |
| Mechanical product | 17,000,000 × 2.53 ≈ 43 million person-household connections |
| Not corrected for | Affected people who share a household, and other double counting |
| Not included | Relatives living elsewhere, friends, caregivers, classmates, customers, and colleagues |
The product is not a count of unique indirectly affected people; it is used only as evidence that accessible air is a household- and community- level question.
Appendix C. Case law detail
Table C1. Cases cited and what they establish
| Case | Court and date | What it held | Why it matters here |
|---|---|---|---|
| Brown v. Roanoke Rehabilitation & Healthcare Center | Federal district court (M.D. Ala.), 2022 | Allowed an ADA claim based on severe, continuing COVID symptoms and a request for temporary leave to survive a motion to dismiss. The court stressed that disability status was fact-driven; it did not hold that every infection or every case of Long COVID is disabling. | Disability status turns on the facts, not on a diagnosis alone. |
| L.E. v. Superintendent of Cobb County School District | Eleventh Circuit, August 2026 | Held that the relevant access question concerned in-person schooling, not education in the abstract; held that four medically vulnerable students had standing and noted that the requested masking accommodation was not facially unreasonable. It nevertheless affirmed denial of preliminary relief for two students because other individualized measures had been found largely effective, while remanding the other two claims. | Access is measured against in-person participation, and effective individualized measures can defeat injunctive relief. |
| Gardner v. Kutztown University | Third Circuit, August 2026 (nonprecedential) | A professor taking immunosuppressive medication sought remote teaching. The court held that a Spring 2023 package— limited classroom capacity, a separate entrance, specialized air filters, and plexiglass—was reasonable as a matter of law, reversing a lower-court judgment that had favored the professor and declining to treat full-time remote work as required, while remanding disputes about earlier semesters. | Engineered air-risk mitigation, on its own, can be a legally sufficient accommodation—though the outcome favored the institution’s substitute measure over the professor’s preferred accommodation, and the decision is not binding precedent. |
The mask cases also expose an implementation distinction. Mask requirements regulate visible human behavior and depend on repeated individual compliance; they became subjects of statutes, litigation, and political conflict. By contrast, NIOSH ranks engineering controls above administrative controls and personal protective equipment and notes that effective engineering controls need minimal user action. It is reasonable to infer—not yet proven by comparative political research—that well-designed ventilation, filtration, or air cleaning may encounter different and potentially lower compliance friction because the protection operates in the background.
Appendix D. Calculation notes
Table D1. Inputs
| Input | Value | Basis |
|---|---|---|
| Median full-time wage (2024) | $1,192 per week = $61,984 per year | BLS; $1,192 × 52 weeks |
| Clinically-severe cohort | roughly 7.7 million | About 3% of U.S. adults (CDC), applied to the adult population implied by the JAMA conversion (17 million ÷ 6.6% ≈ 257.6 million) |
| Broader constituency | about 17 million | 6.6% of U.S. adults (JAMA; 2021 survey) |
Table D2. Method and worked results
| Item | Formula and inputs | Result |
|---|---|---|
| Scenario A | 7,700,000 × 5% × 3/12 × $61,984 | $5.97 billion → $6.0 billion |
| Scenario B | 7,700,000 × 10% × 6/12 × $61,984 | $23.86 billion → $23.9 billion |
| Scenario C | 7,700,000 × 20% × 6/12 × $61,984 | $47.73 billion → $47.7 billion |
| Break-even FTE-years | Annualized cost ÷ $61,984, rounded to the nearest 100 |
$1B: 16,133 → 16,100 $5B: 80,666 → 80,700 $10B: 161,332 → 161,300 |
| Share of cohort | Rounded FTE-years ÷ 7,700,000 | 0.209%; 1.048%; 2.095% |
| Illustrative benefit | 2% × 7,700,000 = 154,000 FTE-years × $61,984 | $9,545,536,000 → about $9.5 billion |
| Gross benefit-cost ratio | $9.5 billion ÷ annualized cost | 9.5:1; 1.9:1; 0.95:1 |
| Net ROI | Gross ratio − 1 | 850%; 90%; -5% |
Rounding convention: break-even FTE-years are rounded to the nearest 100; shares are computed from the rounded FTE-years; ratios and net ROI are derived from the rounded $9.5 billion benefit so that every printed figure can be reproduced by hand. All figures are scenarios or thresholds, not forecasts.